Maccabee Fund
Trading indices – The basics
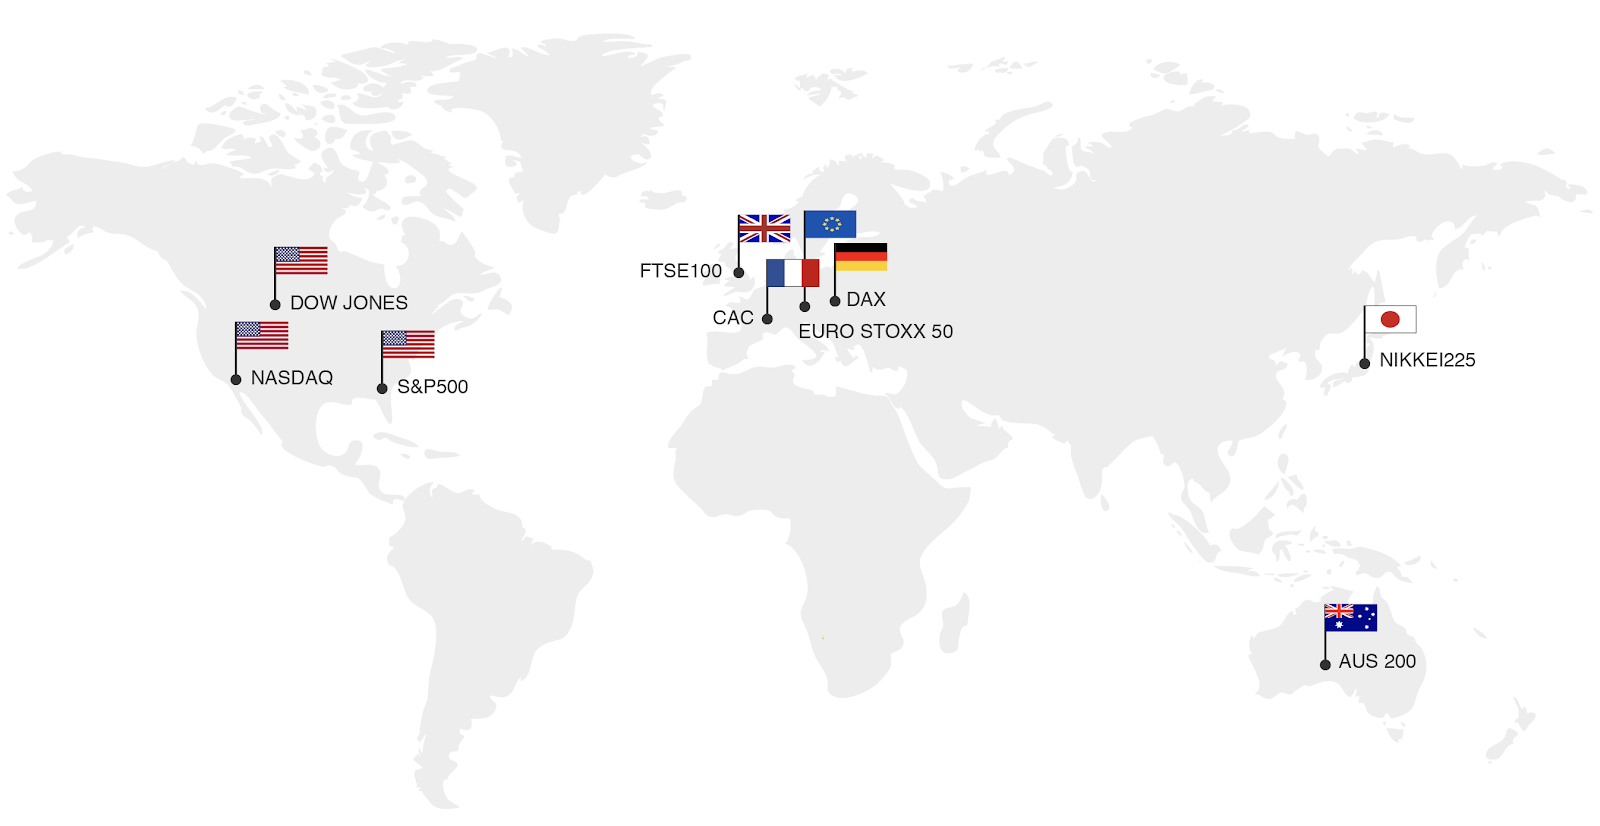
With indices like DAX and Dow Jones grabbing headlines in the financial world on a daily basis, what is an index exactly? Let’s start with the basics. An index, also known as stock market index, is the measurement of a compilation of companies and it is used to assess the performance of a sector, a region or a country’s economy.
Market-value-weighted vs. price-weighted indices
Today indices use different formulas to determine their price, which can be divided into two main categories, which is key for traders to understand before evaluating the performance of an index.
1. Market-value-weighted indices
Market-weighted indices are calculated based on the total market value of its constituent companies. This means, the bigger the company, the larger the impact it has on the index. This is the most common methodology used by indices, with FTSE and DAX being classic examples.
2. Price-weighted indices
This type of indices are calculated based on its companies’ share price. In this case, constituent companies with higher share prices have a bigger impact on the overall index than companies with a lower.
Major Indices Explained
GER30 (DAX)
Also known as the DAX stock index, it contains the 30 top German companies based on market capitalization. The DAX is among the most traded indices around the world due to consistently higher volatility and higher daily ranges than other indices.
SPX500 (US S&P 500)
The SPX500, also known as the S&P 500, is without
doubt the most widely known index in the world. It was created by the publishing firm Standard & Poor’s and includes the top 500 American companies. Due to its strong correlation with other markets, the S&P500 is a popular choice among traders.
US30 (Dow Jones Industrial Average)
The US 30, or most commonly known as the Dow, is the most recognizable stock index in the world, tracking the stocks of 30 companies in nine core market sectors. A unique feature of this index is that it is a price-weighted average and its movements are used as an indicator to gauge risk sentiment around the world.
NAS100 (NASDAQ)
The NASDAQ is an American index best known for representing the technology sector. Although it includes a number of other sectors too, names like Apple, Facebook and Google headline its constituents.
OUR TRADING STRATEGY
We have a philosophy of "Less is more", we try to make our strategy as simple as possible, and not complicate processes that in essence are already quite complex.
STRATEGY (Technical Analysis)
Convergence of Exponential Moving Averages (EMA) 13 and 34.
Overbought and Oversold Relative Strength Index (RSI) readings.
Impulse moves and breakouts of significant Channels .
Impulse moves and breakouts of significant Support and Resistance levels.
EXECUTION
We wait for an impulsive 15 minute candle to break in our trade direction, at the same time being aware of the candles in a bigger time frame (1 Hour Chart). Most important of all is to capitalize on profitable trades and when we lose, limit our loses to 1% of the account.
INDICIES TRADED
US 30 SPX 500
GER 30 NAS 100
TARGETS (3% Take Profits)
US30 70-200 PIPS GER30 60-100 PIPS
SPX500 80-200 PIPS NAS100 40-80 PIPS
STOP-LOSS (1% Maximum Risk)
US30 30-42 PIPS. GER30 28-35 PIPS.
SPX50 30-45 PIPS. NAS100 15-21 PIPS .
**The risk that we take on average is 1% of my Equity per trade to make 3%, an average Risk Reward Ratio of 1 to 3.